Start with the scope#
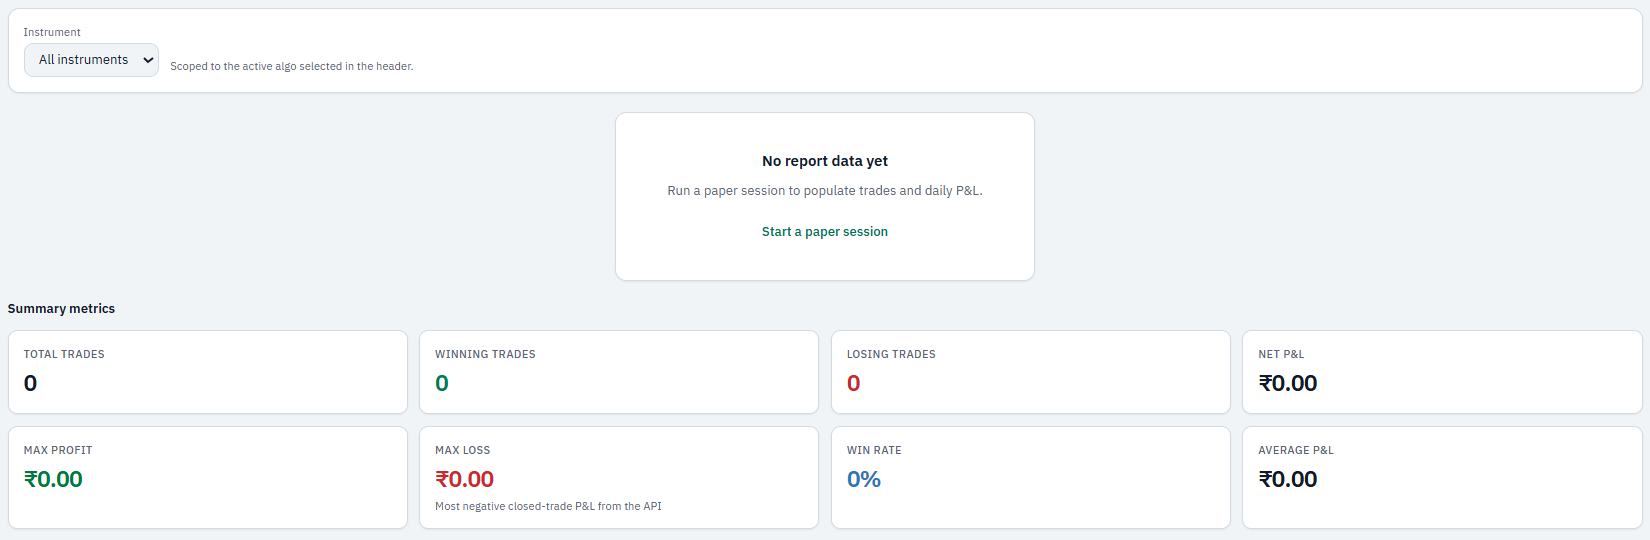
The current Reports screen is labeled Paper-trading performance summary and daily P&L. Use its instrument filter and selected strategy to understand which simulated activity is included.
It displays total trades, winning and losing trades, net P&L, maximum profit and loss, win rate, average P&L, and daily results. A session-level figure and a wider summary can cover different activity. Do not treat this paper report as a live broker statement.
Realized and unrealized P&L#
Realized P&L relates to closed exposure. Unrealized P&L values an open position using the price available to the system. The latter can change as prices update.
For a simple long-position illustration, buying 10 units at ₹100 and selling them at ₹105 gives ₹50 gross profit. Fees and other adjustments can change the net result.
Charges and final records#
Do not assume that a dashboard figure includes brokerage, exchange fees, taxes, or every adjustment unless the screen explicitly says so. Compare live results against the broker's final statements for the same trades.
A stale or missing valuation quote can also affect an open position's displayed result.
Compare like for like#
- Match the date range and execution mode.
- Check which sessions and instruments are included.
- Compare filled quantities and prices.
- Separate open-position valuation from completed trades.
- Check whether each figure is gross or net of charges.
Save useful evidence#
If the view offers an export, retain the selected filters with it. Otherwise, use a redacted screenshot and session references when reporting a discrepancy. Do not interpret a missing export control as a failed report.
See orders and positions when the difference comes from an unresolved execution.