Open the Portfolio#
Choose Portfolio in the sidebar. Pick a window of 30D, 90D, or 1Y; the page opens on 90 days. The header shows the date the window starts from.
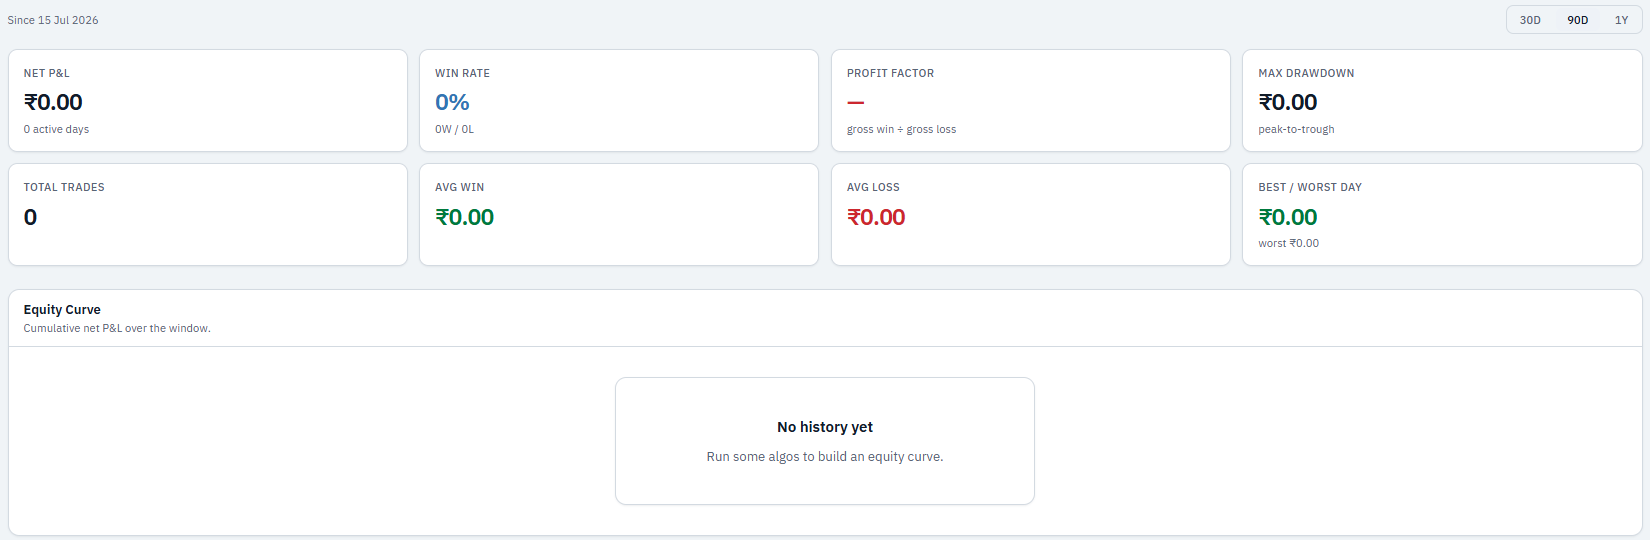
Summary figures#
| Figure | What it shows |
|---|---|
| Net P&L | Total net profit or loss across all algorithms in the window, with the number of active trading days |
| Win Rate | Winning trades as a share of all closed trades |
| Total Trades | Closed trades in the window |
| Profit Factor | Gross profit from winning trades divided by gross loss from losing trades. Above 1 means winners outweighed losers |
| Avg Win / Avg Loss | The average result of a winning and of a losing trade |
| Best / Worst Day | The highest and lowest single-day net P&L |
| Max Drawdown | The largest fall in rupees from a running peak of cumulative P&L to a later low |
Equity Curve#
The chart plots cumulative net P&L day by day across the window. A rising line means the running total grew. A flat stretch can mean no trading or offsetting results.
Example of drawdown: if cumulative P&L rises to ₹5,000, falls to ₹3,200, and then recovers, the drawdown from that peak is ₹1,800. Max Drawdown reports the largest such fall in the window. This is an illustration, not a typical result.
By Algo#
The table attributes closed trades to each algorithm: trades, win rate, net P&L, and its share of the total (Contribution). Freedom Fighter legs and Stock Basket trades are included and attributed to their algorithm.
Read it correctly#
- Figures come from SSAlgo's daily P&L and closed-trade records. Open positions are not included until they close.
- Do not assume brokerage, taxes, or exchange charges are included unless the screen says so. Compare Live results with your broker's contract notes and statements.
- For a single algorithm or session, use Reports and the algorithm's monitor.
"No history yet" means no daily results exist in the selected window. Run algorithms, or choose a longer window.